This year has been one of the most challenging for the global travel industry. Many airports were closed for weeks or even months. While travel slowly recovers we want to inform consumers which airports are the most convenient to travel from and to in Europe. Airports with more space per passenger rank higher in our analysis. This is helpful to know for travellers who try to maintain distance from others.
In order to prevent a negative passenger experience and pick the optimal hubs for future trips, we examined Europe’s 30 largest airports (by passenger volume) and ranked them in terms of passenger experience, ranked according to a mix of factors ranging from location and transportation options to in-airport experience and flight network access. This should help passengers to identify their airport of choice.
This is the second Annual Edition of the European Consumer Airport Index, seeking to rank Europe’s most passenger-friendly airports. We reached out to all of Europe’s Top 30 airports and asked for relevant data, but also found data in annual reports, online statistics, and conducted our own research to collect all necessary information. Performance numbers are for the year 2019. The new category Covid-Testing looks at data available on August 1st 2020.
A special mention to the new Istanbul airport for being the first time in the index and Berlin Tegel airport being considered the last time in this index.
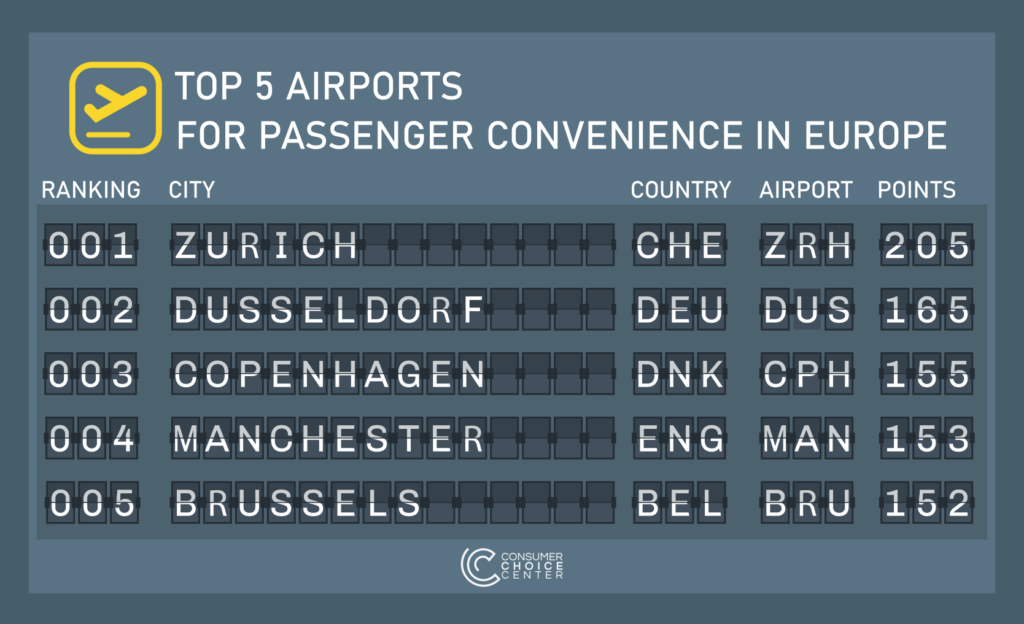
Overall Score: Top 5 Airports for Passenger Convenience in Europe
The European Passenger Convenience Ranking shows mainly northern European airports in the Top 5. The lack of eastern European airports can also be explained by three Moscow airports being among Europe’s Top 30 airports in terms of passenger volume.
The three best ranked airports Zurich, Copenhagen and Duesseldorf all have between 25 and 32 million passengers per year and are merely the third of the size of Europe’s largest airports London Heathrow and Paris Charles De Gaulle.
The European Consumer Airport Index 2020

Research Note: We strive to improve the quality of the underlying data of this index year by year and aim to refine its methodology moving forward. We sometimes faced contradictory information and indicators measured differently by different airports (e.g. number of destinations is sometimes shown as average destinations flown to throughout the year, sometimes includes charter destinations, and sometimes show the total destinations connected to in one year). We ask the readers of this index to acknowledge the difficulties in working with heterogeneous data and caution users of this index to be aware of the underlying data complications.


