
This is a post by a Guest Author.
Disclaimer: The author’s views are entirely his or her own, and don’t necessarily reflect the opinions of the Consumer Choice Center.
There are ongoing debates about who has been better handling the Covid-19 pandemic: testing or lockdown?
With so many people confined to their homes, passions are running high, and there are ongoing debates about who has been better handling the Covid-19 pandemic. So much so that it feels like comparing and contrasting countries and their trajectories has become sort of a global pastime.
Nearly all developed countries (and others) have put their populations under severe lockdowns and emphasized social distancing as the silver bullet against the spread of the virus. Sweden, however, has recently been castigated for failing to put its population under a lockdown like every other country, especially other Nordic countries which it is compared and contrasted against.
The problem is that it is quite hard to compare the performance of two randomly selected countries. For instance, on every level Norway seems to be doing much better than Sweden. That said, one can always find a bunch of other countries that are doing much worse despite having been under lockdown for some time.
It should be noted that Sweden has made some questionable decisions, regardless of social distancing. It failed to ramp up testing with increasing cases around March 20, and it only closed its nursing homes for visits in early April.
But aren’t lockdowns clearly working?
Many people have still argued that lockdowns are clearly working because the epidemic has slowed shortly after their imposition. However, it is important that we are careful when inferring that lockdowns were responsible for the decline. There may be a correlation between the two, but as everyone should know, correlation does not necessarily mean causation, and there may be other intervening variables. It is vital that we not jump to conclusions too fast. While many people believe, and many epidemiological models assume, that unchecked epidemics just grow exponentially until more than half of the population gets infected, the evidence for Covid-19 increasingly suggests otherwise.
Several research papers (e.g. here and here) argued that the dynamics of the Covid-19 pandemic are well-described by exponential functions only at the early stage, after which so-called power-law functions are a much better fit. A detailed study of the outbreak in the initially hit communes in Lombardy also suggests that in each commune, it started slowly, then briefly became exponential and then slowed, all that before any significant intervention.
To help you better understand what the mathematical jargon above means and why it is so important, consider two simple functions, y=2x and y=x2. The first function is exponential and the second function is a power-law one. You will better see the crucial difference between them if they are plotted together.

If these functions were describing an epidemic, then the x-axis would mean rounds of transmission. In the beginning there is one infected person in both cases. Then, until the fifth round the functions seem to grow in at an almost similar speed but afterwards, they diverge dramatically.
When researchers talk about an epidemic growing first exponentially and then in accordance with a power law, they mean that the growth of the epidemic looks like the hybrid function (first, y=2x and y=x2 after round 5) below. Its growth clearly slows a lot after the fifth round.

Why could an epidemic grow exponentially, first, and then slow down on its own? Here, it is important to remember that real societies are complex. Instead of interacting with random people every now and then, people tend to form groups (or clusters, in scientific terminology) and live in local areas within which interactions are much more intense than outside of them. With obvious implications for infection transmission.
What probably changes at the early stage of the epidemic is that so-called superspreader events are much likelier. Such events, where single infected people spread the virus to scores, hundreds or even thousands of people, have clearly played an enormous role in Covid-19. It is enough to mention the Shincheonji Church of Jesus in South Korea, the tragic gathering of French catholics in Mulhouse and the first coronavirus-hit hospitals in Lombardy. At these events, infected people have an opportunity to spread the virus way beyond their clusters of interactions.
After the initial stage, when everyone becomes aware that the epidemic is in the community and significant events are cancelled, the infection may get increasingly isolated within clusters, first, grow slower and then start falling off. The available data is increasingly hinting at this process in play. In Italy, cases appear to have peaked on the day the national lockdown was announced. In the US, they appear to have peaked on March 20.
Lockdowns could even be counterproductive
A more speculative but still plausible idea is that lockdowns could, in fact, not merely coincide with the slowing-down of Covid-19 without causing it but actually create more damage than they prevent.
Many people believe that if some social distancing (like closing bars or canceling events) is desirable than extreme social distancing like lockdowns that keeps most people at home most of the time must be even more beneficial. However, this potentially ignores two important facts about Covid-19 and viral diseases in general.
First, it is abundantly clear that Covid-19 overwhelmingly spreads in closed, often poorly ventilated spaces and through close contacts. Secondly, as Robin Hanson convincingly argued, there is a wealth of evidence that the severity of viral disease depends on the viral dose received. This means that if families are forced to stay at home together all the time, this may create perfect conditions for the virus to spread and especially cause severe disease.
The data from Google about actual social distancing patterns in several countries hit by Covid-19 shows that Italy, Spain and France have had by far the most extreme social distancing, and the UK was starting to catch up with them after its lockdown. Yet, these four countries have some of the highest fatality rates in the world per population and detected cases.
Could testing explain things better?
A better way to try to make sense of the causation is to try to identify a bunch of countries that have something important in common. The most important thing in any epidemic is to minimize deaths, and there is a group of countries that seem to have far fewer deaths by population size, and per identified infections, than others. These countries include Iceland, Germany, South Korea, Taiwan, Austria, and Norway. You can see how low their case fatality rates are compared to other countries with a lot of cases here (see the “death rates” column).
What makes those countries succeed in driving down deaths? One would actually be surprised to learn that none of these countries is, or was, under total lockdown. South Korea hasn’t even closed bars and restaurants. This shows that extreme social distancing measures are not necessarily the best explanation.
The real answer may largely lie in how many tests those countries have been doing compared to others. Testing may reduce fatality rates by giving public health responders valuable information and helping to isolate and quarantine those that carry the virus before they spread it to vulnerable groups like the elderly.
Iceland is the absolute champion at testing. It has already conducted 28,992 tests, which is more than 8% of its entire population. It also has the world’s lowest case fatality rate from Covid-19 at 0.38%. Iceland isn’t an anomaly, and using Iceland as an example isn’t cherry picking. Researchers Sinha, Sengupta and Ghosal showed that country death rates from Covid-19 are significantly correlated with the intensity of testing. They did not, however, control for the potential impact of lockdowns and other stringent social distancing measures.
Testing and outcomes by region
In addition to national data, one can also look at regional data where it is available and see if the testing/fatality relationship still holds. Italy has been publishing detailed regional statistics on Covid-19 starting from February 24. If we plot tests per confirmed cases in each region with reported fatalities per million inhabitants, we get the following picture:
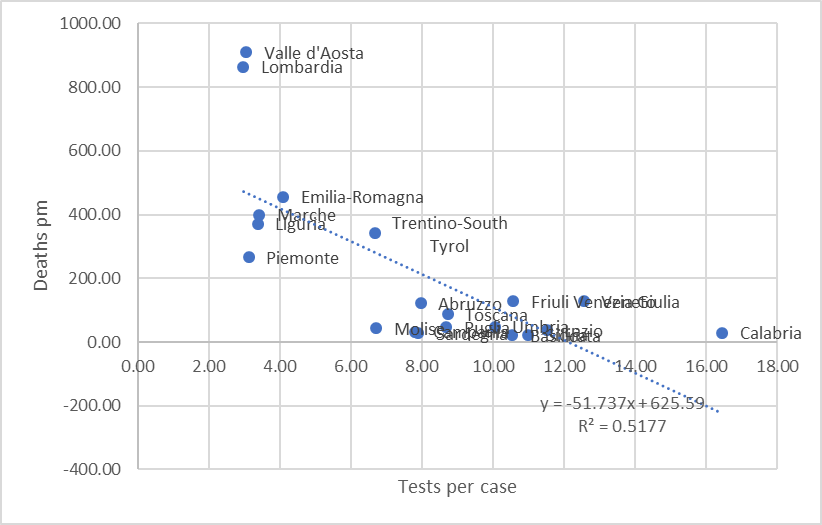
The chart surprisingly shows us that Italy’s worst hit region isn’t Lombardy, and that it is actually the little-known Aosta Valley. We also see that there is a clear negative relationship between the intensity of testing and fatality rates. In fact, the former seems to explain more than half of the variation in the latter, and the regression coefficient is statistically significant (the p-value is 0.0003).
To conclude, it will take a long time and careful research to sort out why some countries and regions have gone through the Covid-19 pandemic much less damaged than others. That said, one thing seems to be increasingly clear. When the dust settles it will be clear that testing will be a significant factor, and that the importance of social distancing will be diminished.
Guest Author: Daniil Gorbatenko
The Consumer Choice Center is the consumer advocacy group supporting lifestyle freedom, innovation, privacy, science, and consumer choice. The main policy areas we focus on are digital, mobility, lifestyle & consumer goods, and health & science.
The CCC represents consumers in over 100 countries across the globe. We closely monitor regulatory trends in Ottawa, Washington, Brussels, Geneva and other hotspots of regulation and inform and activate consumers to fight for #ConsumerChoice. Learn more at consumerchoicecenter.org